ECG Part 2: Specific Conditions on ECG
Sat Aug 08 2026
By B. Hassan

Ventricular Hypertrophy
Hypertrophy of the ventricle causes the affected chamber to generate greater than normal electrical activity. Physiologically, the thicker-walled left ventricle produces forces that are more prominent than those of the right ventricle. However, in right ventricular hypertrophy, the increased right-sided impulses may outweigh those of the left. Thus, leads V1 and V2, which overlie the right ventricle, record greater-than-normal upward defections the R wave becomes taller than the S wave in those leads, the opposite of the normal situation. In addition, the increased right ventricular mass shifts the mean axis of the heart, resulting in right axis deviation (mean axis greater than +90 degrees).
In left ventricular hypertrophy, leads that directly overlie the left ventricle (chest leads V5 and V6 and limb leads I and aVL) show taller-than-normal R waves. Leads overlying the right side of the heart (V1 and V2) demonstrate the opposite: deeper-than-normal S waves.
Many different criteria are used to diagnose left ventricular hypertrophy by ECG. These criteria usually incorporate a measurement called SV1 + RV5, which represents the sum of the depth of the S wave in lead V1 and the height of the R wave in lead V5.
For example, the Sokolow-Lyon Criteria, which is very commonly used, specifies that LVH is present if any of the following measurements are met:
-
SV1 + RV5 is mV
-
The R wave amplitude in aVL is mm
-
The R wave in V6 is mm in men or mm in women
While the Sokolow-Lyon criteria are highly specific (i.e. very good at confirming LVH when it is present), they have low sensitivity (they miss many LVH cases).
The Peguero-Lo Presti Criteria is newer more sensitive criteria that measures the deepest S wave in any lead () and adds it to the S wave in V4 (:
- Men:
- Women:
Non-voltage criteria
So far, we have talked about the Sokolow-Lyon and the Peguero-Lo Presti Criteria, there are called the voltage criteria. But the diagnosis of LVH is far more accurate when accompanied by non-voltage findings like left axis deviation, left atrial enlargement, and prolonged QRS duration or R-wave peak time in leads V5 and V6.
References and further reading:
- https://www.ecgbook.com/lv-hypertrophy/
- https://www.healio.com/cardiology/learn-the-heart/ecg-review/ecg-topic-reviews-and-criteria/left-ventricular-hypertrophy-review
- https://litfl.com/left-ventricular-hypertrophy-lvh-ecg-library/
Bundle Branch Blocks
Interruption of conduction through the right or left bundle branches may develop from ischemic or degenerative damage. As a result, the affected ventricle does not depolarize in the normal sequence. Rather than rapid uniform stimulation by the Purkinje fibers, the cells of that ventricle must rely on relatively slow myocyte-to-myocyte spread of electrical activity traveling from the unaffected ventricle. This delayed process prolongs depolarization and widens the QRS complex.
A normal QRS duration is less than or equal to 0.1 seconds ( small boxes). When a bundle branch block widens the QRS duration from 0.10 to 0.12 seconds (2.5 to 3.0 small boxes), an incomplete bundle branch block is present. If the QRS duration is greater than 0.12 seconds ( small boxes), complete bundle branch block is identified.
Right bundle branch block (RBBB)
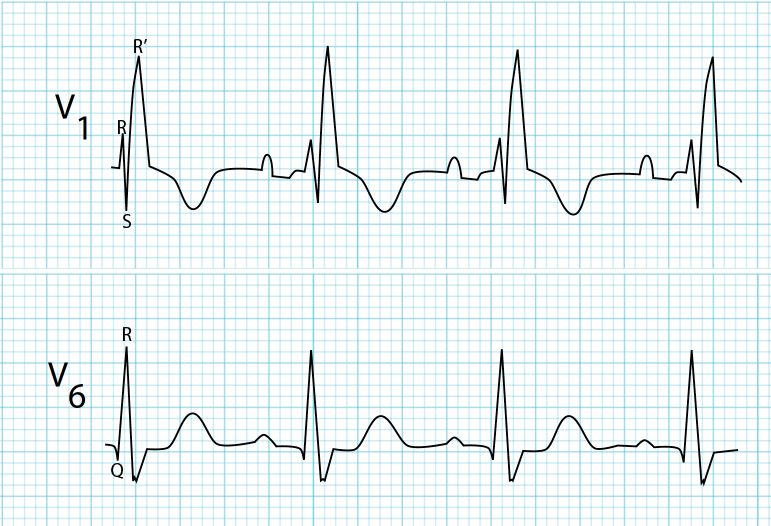
In RBBB, normal depolarization of the right ventricle is interrupted. In this case, initial depolarization of the ventricular septum (which is stimulated by a branch of the left bundle) is unaffected so that the normal small R wave in lead V1 and small Q wave in lead V6 are recorded.
As the wave of depolarization spreads down the septum and into the left ventricular free wall, the sequence of depolarization is indistinguishable from normal, because left ventricular forces normally outweigh those of the right. However, by the time the left ventricle has almost fully depolarized, slow cell-to-cell spread has finally reached the “blocked” right ventricle and depolarization of that chamber begins unopposed by left ventricular activity.
This prolonged depolarization process widens the QRS complex and produces a late depolarization current in the direction of the anteriorly situated right ventricle. Since the terminal portion of the QRS complex represents these right ventricular forces acting alone, the ECG records an abnormal terminal upward deflection (known as an R′ wave) in lead V1 (over the right ventricle) and a downward deflection (S wave) in V6 (opposite to the right ventricle).
The appearance of the QRS complex in lead V1 in right bundle branch block (upward R, downward S, then upward R′) is often described as having the appearance of “rabbit ears.”
Left bundle branch block (LBBB)
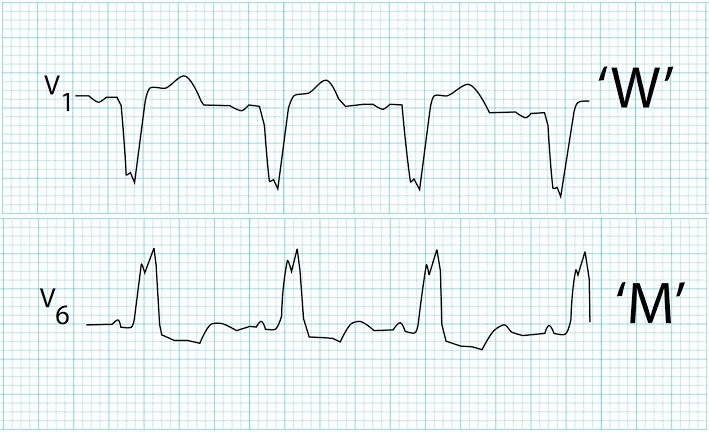
LBBB produces even more prominent QRS abnormalities. In this situation, normal initial depolarization of the left septum does not occur; rather, the right side of the ventricular septum is first to depolarize. Thus, the initial forces of depolarization are directed toward the left ventricle instead of the right. Therefore, an initial downward defection is recorded in V1, and the normal small Q wave in V6 is absent.
Only after depolarization of the right ventricle does slow cell-to-cell spread reach the left ventricular myocytes. These slowly conducted forces inscribe a widened QRS complex with abnormal terminally upward defections in the leads overlying the left ventricle (V5 and V6).
Overall, this results in a widened QRS complex with an abnormal W-shaped Q wave in V1 and an abnormal M-shaped R wave in V6.
Fascicular block
Recall from part 1 that the left bundle branch subdivides into two main divisions, termed fascicles: the left anterior fascicle and the left posterior fascicle. Although LBBB implies that conduction is blocked in the entire left bundle branch, impairment can also occur in just one of the two fascicles, resulting in left anterior or left posterior fascicular blocks (also termed hemiblocks).
The main significance of fascicular blocks in ECG interpretation is that they can markedly alter the mean QRS axis. Anatomically, the anterior fascicle of the left bundle runs along the front of the left ventricle toward the anterior papillary muscle, whereas the posterior fascicle travels to the posterior papillary muscle. Under normal conditions, conduction via the left anterior and left posterior fascicles proceeds simultaneously, such that electrical activation of the left ventricle is uniform, spreading outward from the bases of the two papillary muscles. However, if a hemiblock is present, then initial LV depolarization arises exclusively from the unaffected fascicle.
Left anterior fascicular block (LAFB)
In the case of LAFB, left ventricular activation begins via the left posterior fascicle alone at the posterior papillary muscle and then spreads to the rest of the ventricle. This means that the initial impulses are directed downward and toward the patient’s right side.
This results in a positive defection (small R wave) in the inferior leads (II, III, and aVF) and a negative defection (small Q wave) in the left lateral leads, I and aVL.
As depolarization then spreads upward and to the left, toward the “blocked” regions of the left ventricle, a positive defection (R wave) is inscribed in leads I and aVL, while a negative defection (S wave) develops in the inferior leads. The predominance of these left forces, resulting from the abnormal activation of the anterior superior left ventricular wall, results in left axis deviation (more negative than −45 degrees).
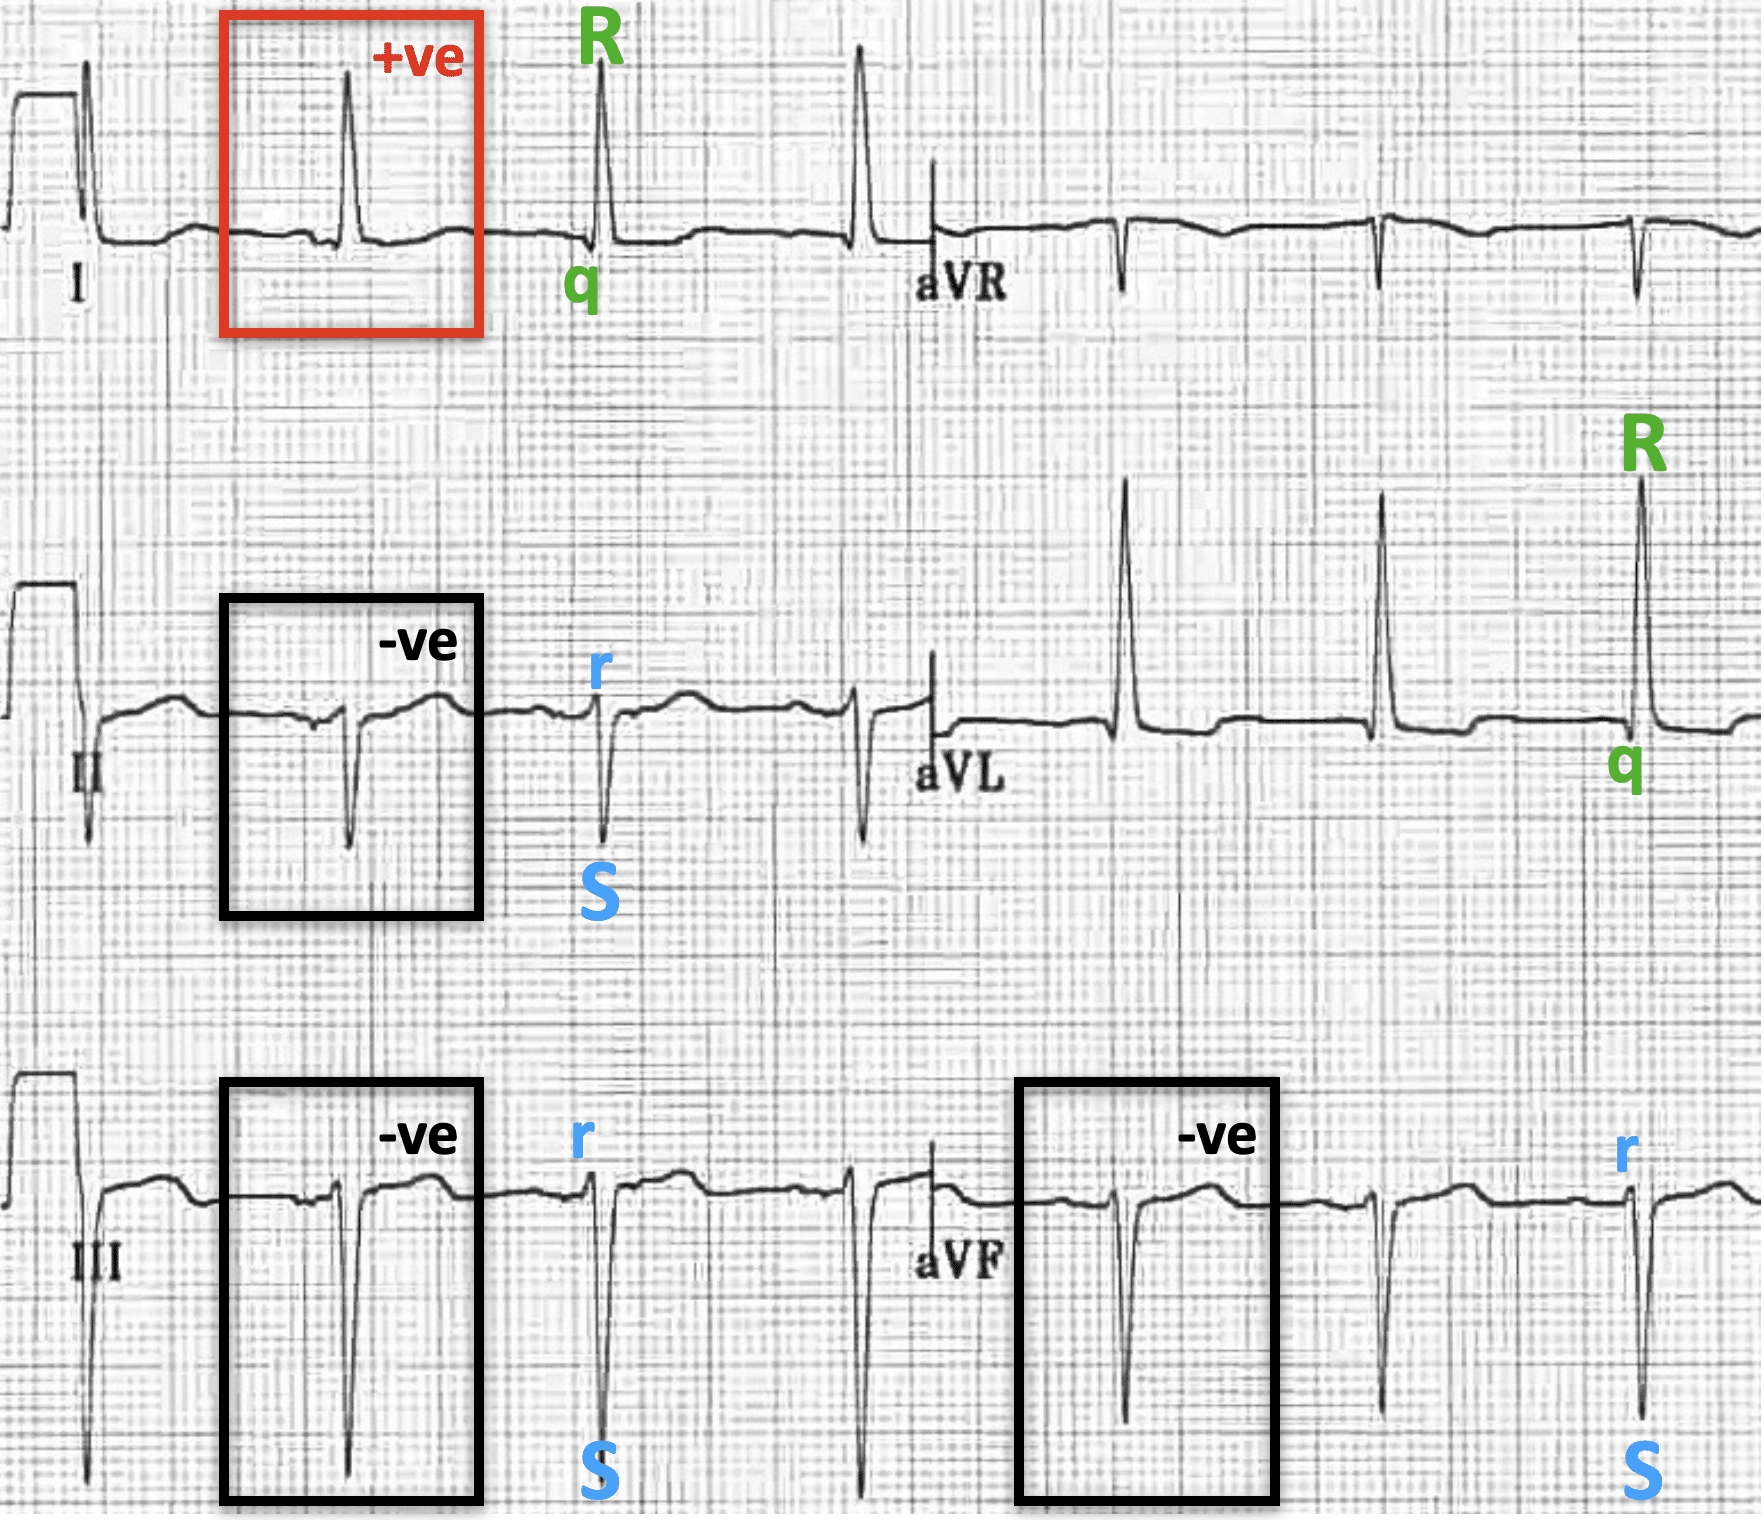
To summarize, typical ECG of LAFB include:
- rS complexes in leads II, III, aVF, with small R waves and deep S waves
- qR complexes in leads I, aVL, with small Q waves and tall R waves
- Left Axis Deviation
Associated features include:
- QRS duration normal or slightly prolonged (80-110ms)
- Increased QRS voltage in limb leads
Left posterior fascicular block (LPFB)
LPFB is less common than LAFB. In LPFB, ventricular activation begins via the left anterior fascicle alone at the base of the anterior papillary muscle. As that anterosuperior left ventricular region depolarizes, the initial forces are directed upward and to the patient’s legt (creating a positive R wave in leads I and aVL and a negative Q wave in the inferior leads). As the impulse then spreads downward and to the right toward the initially blocked region, an S wave is inscribed in leads I and aVL, while an R wave is recorded in leads II, III, and aVF. Because the bulk of these delayed forces head toward the patient’s right side, right axis deviation of the QRS mean axis occurs.
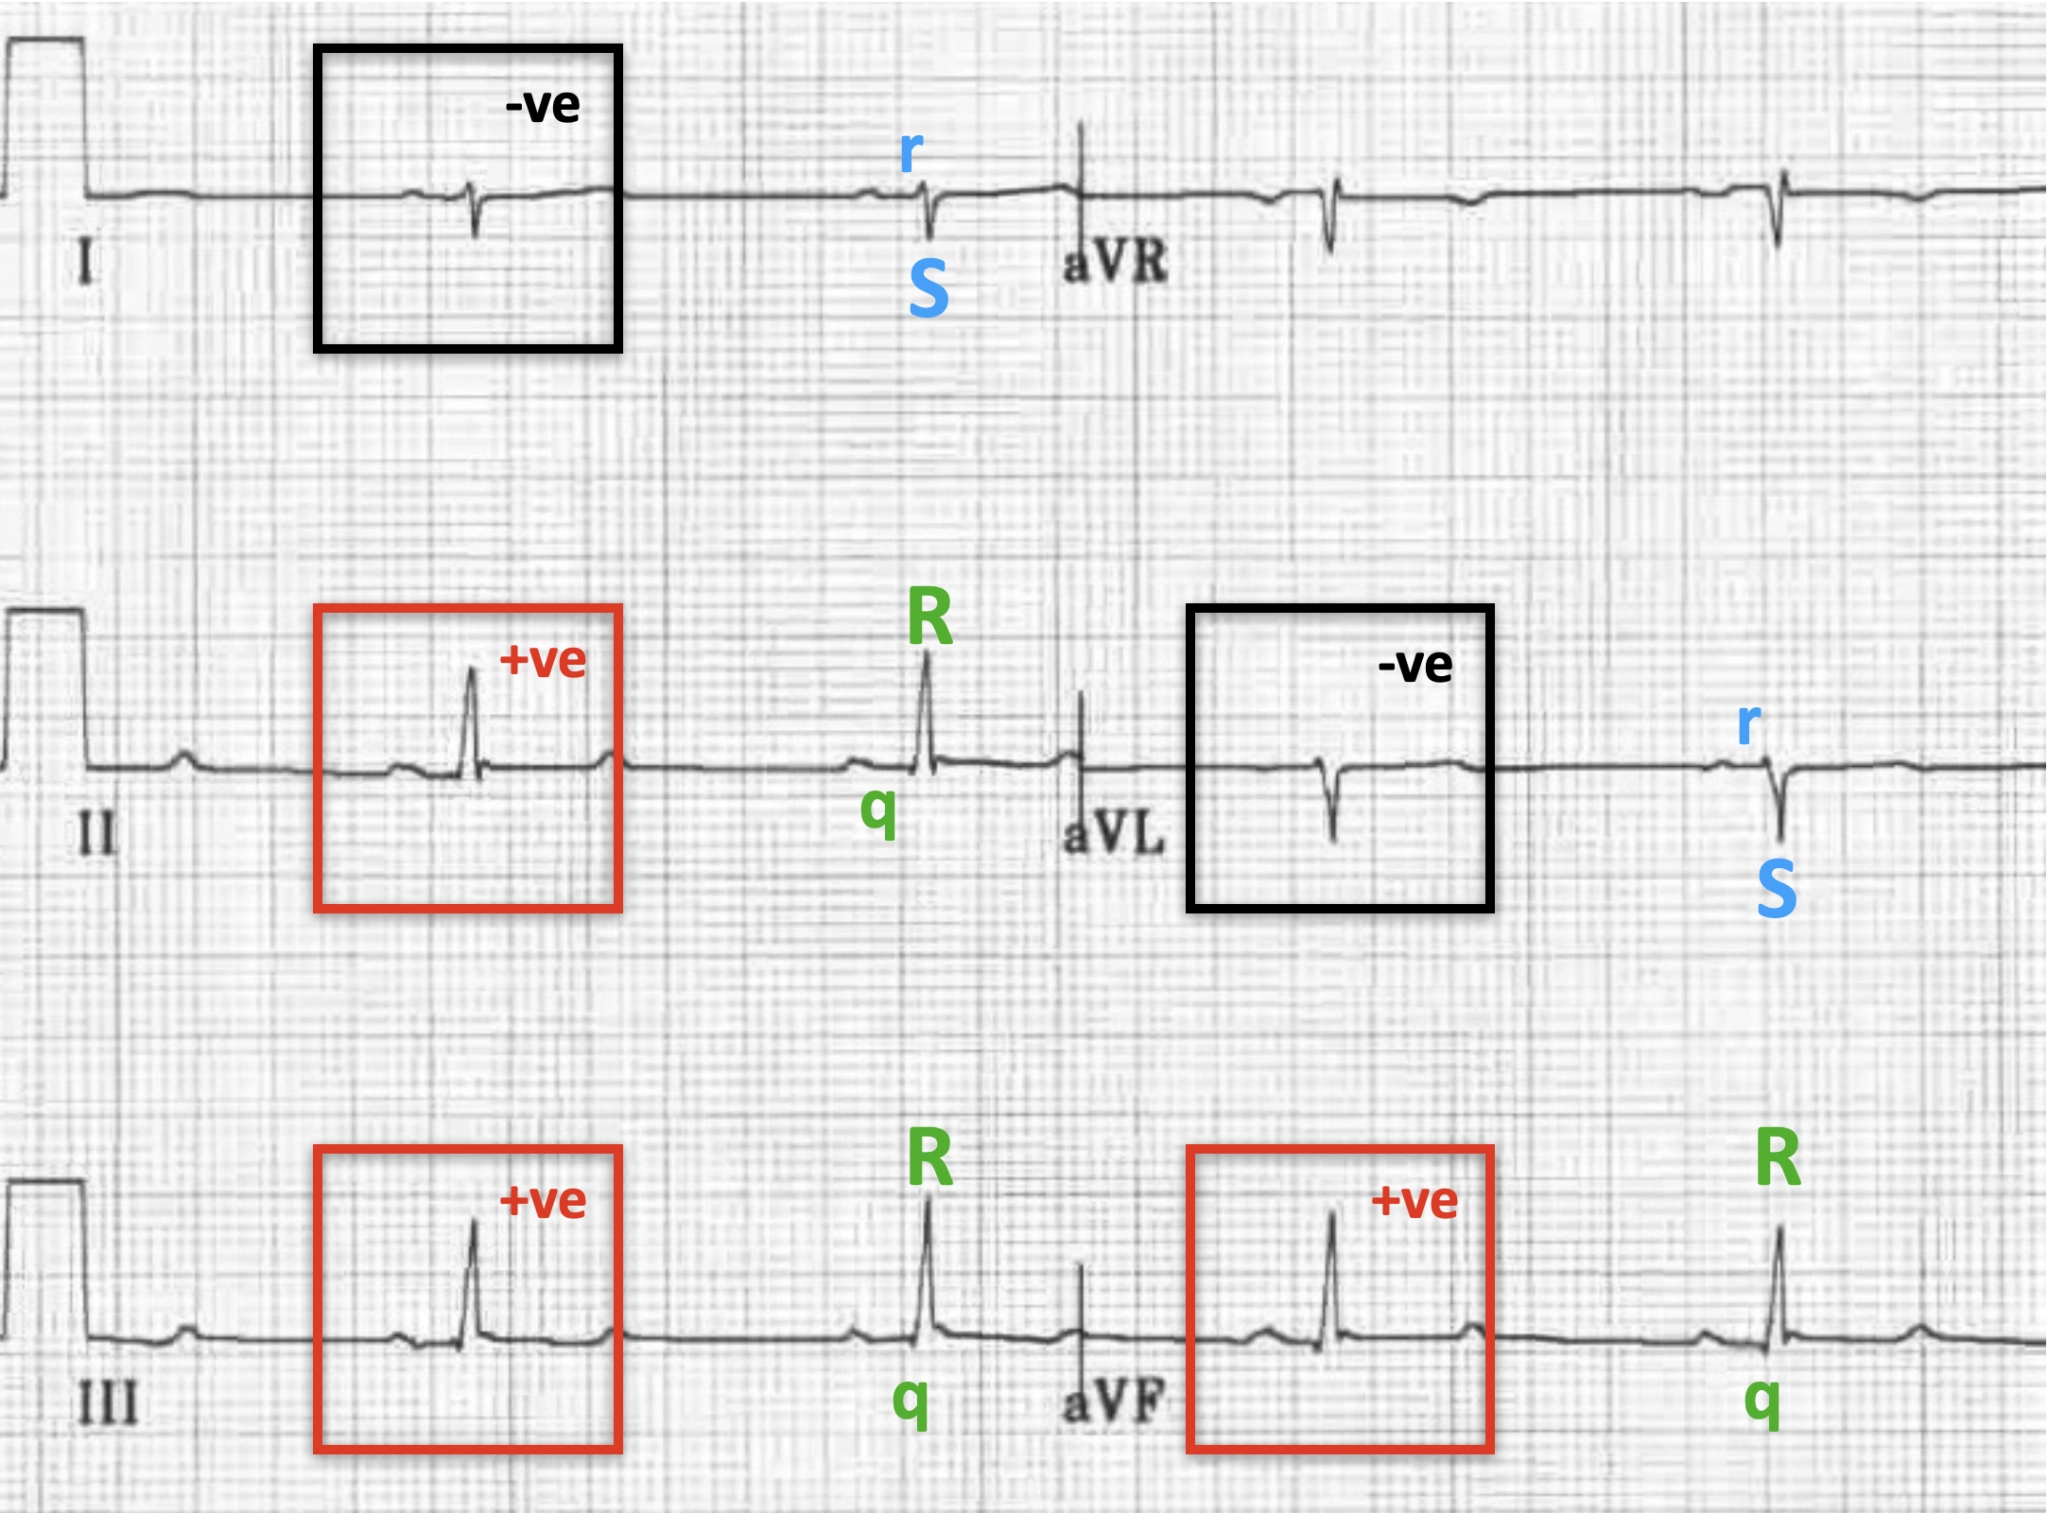
To summarize, typical ECG of LPFB, demonstrating slightly prolonged QRS duration, prolonged R wave peak time in aVF, and:
- rS complexes in leads I and aVL, with small R waves and deep S waves
- qR complexes in leads II, III and aVF, with small Q waves and tall R waves
- Right Axis Deviation
Associated features include:
- QRS duration normal or slightly prolonged (80-110ms)
- Increased QRS voltage in limb leads
Further reading
For more information and example of fascicular blocks:
Pathologic Q waves in Myocardial Infarction
Sudden complete occlusion of a coronary artery typically results in a syndrome known as acute ST-segment elevation myocardial infarction (STEMI). When this occurs, a sequence of abnormalities of the ST segment and T wave evolves over a period of hours.
Unless reperfusion of the occluded artery is quickly established, irreversible necrosis of the heart muscle served by that vessel ensues and is marked by the formation of pathologic Q waves as part of the QRS complex.
Recall that it is normal for small initial Q waves to appear in some of the ECG leads. In distinction, pathologic Q waves are more prominent, typically having a width greater than or equal to 1 small box ( seconds) or a depth greater than 25% of the total height of the QRS.
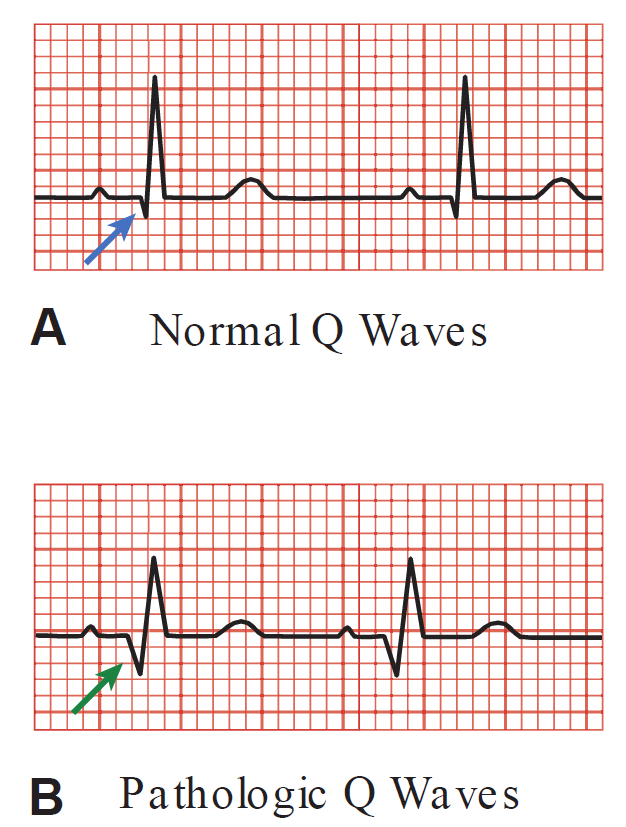
The ECG lead groupings in which pathologic Q waves appear reflect the anatomic site of the infarction; pathologic Q waves develop in the leads overlying infarcted tissue because necrotic muscle does not generate electrical forces. This results in an imbalance whereby electrical forces generated by other regions of healthy myocardium become abnormally unopposed. Thus, the ECG electrode over the infarcted region detects electrical currents from the healthy tissue on opposite regions of the ventricle, which are directed away from the infarct and the recording electrode, thus inscribing the downward defection. Q waves are permanent evidence of a STEMI; only rarely do they disappear over time.
-
If the inferior portion of the heart is infarction, leads II, III, aVF will show the pathological Q waves. This region is most commonly supplied by the right coronary artery.
-
If the anteroseptal portion of the heart is infarction, leads V1 and V2 will show the pathological Q waves. This region is most commonly supplied by the proximal left anterior descending artery.
-
If the anteroapical portion of the heart is infarction, leads V3 and V4 will show the pathological Q waves. This region is most commonly supplied by the distal left anterior descending artery.
-
If the anterolateral portion of the heart is infarction, leads V5, V6, aVL, and I will show the pathological Q waves. This region is most commonly supplied by the left circumflex artery.
-
As for infarctions in the posterior wall, leads V1 and V2 will show tall R waves (not pathological Q waves). This region is most commonly supplied by the distal right coronary artery.
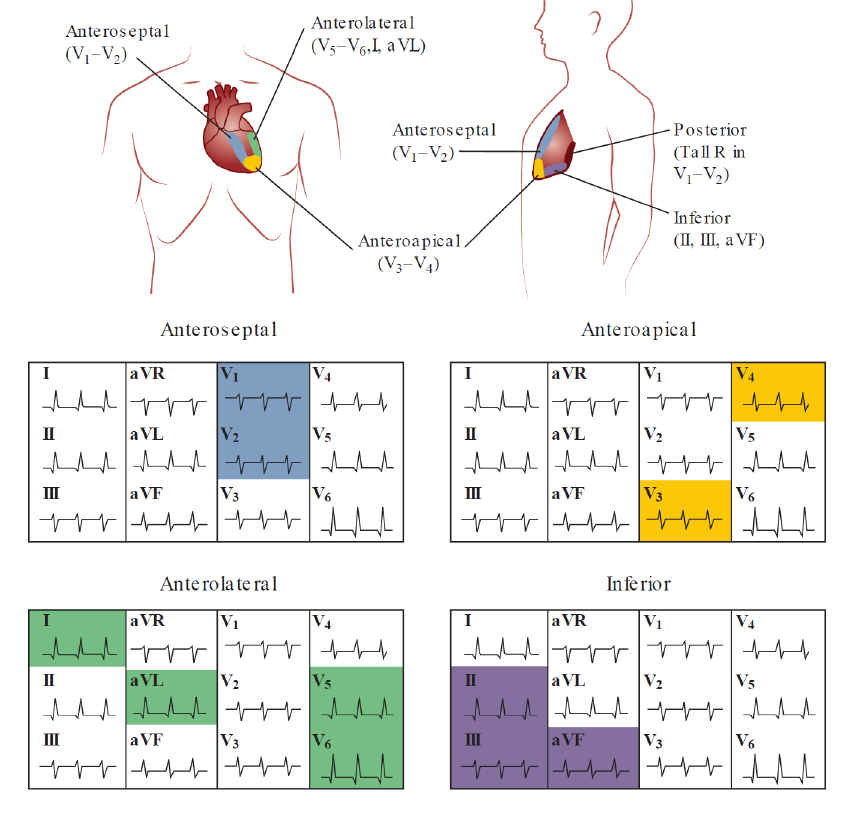
Because standard electrodes are not typically placed on the patient’s back overlying the posterior wall, other leads must be relied on to indirectly identify the presence of such an infarction. Chest leads V1 and V2, which are directly opposite the posterior wall, record the inverse of what leads placed on the back would demonstrate. Therefore, taller-than-normal R waves in leads V1 and V2 are the equivalent of pathologic Q waves in the diagnosis of a posterior wall MI. It may be recalled that RVH also produces tall R waves in leads V1 and V2. However, RVH causes right axis deviation, which is not a feature of posterior wall MI.
It is important to note that if a Q wave appears in only a single ECG lead, it is not diagnostic of an infarction. True pathologic Q waves should appear in all nodes opposite to the area. For example, if a pathologic Q wave is present in lead III but not in II or aVF, it likely does not indicate an infarction.
Also, pathological Q waves are disregarded in lead aVR because electrical impulses are normally directed away from the right arm.
Finally, in the presence of LBBB, Q waves are usually not helpful in the diagnosis of MI because of the markedly abnormal pattern of depolarization in that condition.
Transient Myocardial Ischemia
Among the most important abnormalities of the ST segments and T waves are those related to coronary artery disease. Because ventricular repolarization is very sensitive to myocardial perfusion, reversible deviations of the ST segments and T waves (ST segment depression and/or T wave inversion) are common during transient episodes of myocardial ischemia.
Acute ST-Segment Elevation MI
As described in earlier, pathologic Q waves are associated with one major type of myocardial infarction (STEMI) but do not differentiate between an acute event and an MI that occurred weeks or years earlier.
However, an acute STEMI results in a temporal sequence of ST and T-wave abnormalities that permits this distinction. The initial abnormality is elevation of the ST segment, often with a peaked appearance of the T wave. At this early stage, myocardial cells are still viable and Q waves have not yet developed.
In patients who achieve successful acute coronary reperfusion, the ST segments return to baseline and the sequence of changes described in the next paragraph do not occur.
In patients who do not achieve successful reperfusion within several hours, myocyte death leads to loss of the amplitude of the R wave and pathologic Q waves begin to be inscribed by the ECG leads positioned over the infarction territory.
During the first 1 to 2 days following infarction, the ST segments remain elevated, the T wave inverts, and the Q wave deepens. Several days later, the ST-segment elevation returns to baseline, but the T waves remain inverted. Weeks or months following the infarct, the ST segment and T waves have usually returned to normal, but the pathologic Q waves persist, a permanent marker of the MI.
If the ST segment remains elevated several weeks later, it is likely that a ventricular aneurysm has developed at the site of infarction.
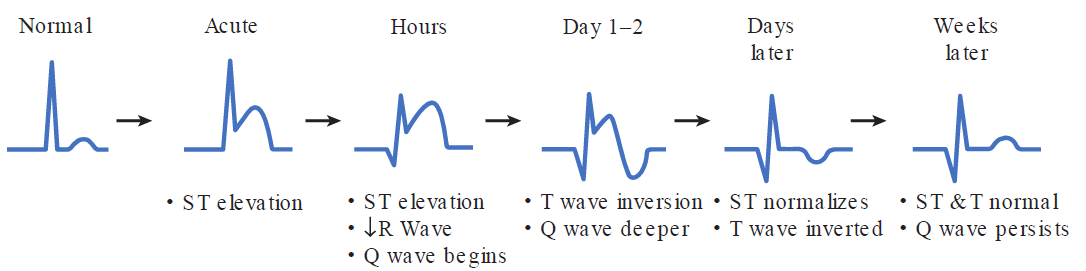
These changes are recorded by the leads overlying the zone of infarction described earlier. Typically, reciprocal changes are observed in leads opposite that site. For example, in acute anteroseptal MI, ST-segment elevation is expected in chest leads V1 and V2; simultaneously, however, reciprocal changes (ST depression) may be inscribed by the leads overlying the opposite (inferior) region, namely in leads II, III, and aVF.
The mechanism by which ST-segment deviations develop during acute MI has not been established with certainty. It is believed, however, that the abnormality results from injured myocardial cells immediately adjacent to the infarct zone producing abnormal currents. One explanation, the diastolic current theory, contends that these damaged cells are capable of depolarization but are abnormally “leaky,” allowing ionic flow that prevents the cells from fully repolarizing. Because the surface of such partially depolarized cells in the resting state would be relatively negatively charged compared with normal fully repolarized zones, an electrical current is generated between the two regions. This current is directed away from the more negatively charged ischemic area, causing the baseline of the ECG leads overlying that region to shift downward. Following ventricular depolarization (the QRS complex) after all the myocardial cells have fully depolarized (including those of the injured zone), the net electrical potential surrounding the heart is true zero. However, compared with the abnormally displaced downward baseline, the ST segment appears elevated. As the myocytes then repolarize, the injured cells return to the abnormal state of diastolic ion leak, and the ECG again inscribes the abnormally depressed baseline. Thus, ST elevation in acute STEMI may in part reflect an abnormal shift of the recording baseline.
The systolic current theory of ST segment shifts contends that in addition to altering the resting membrane potential, ischemic injury shortens the action potential duration of affected cells. As a result, the ischemic cells repolarize aster than neighboring normal myocytes. Since the positive surface charge of the damaged myocytes is restored earlier than that of the normal cells, a voltage gradient develops between the two zones, creating an electrical current directed toward the ischemic area. This gradient occurs during the ST interval of the ECG, resulting in ST elevation in the leads overlying the ischemic region.
Acute Non–ST-Segment Elevation MI
Not all acute myocardial infarctions result in ST-segment elevation and pathological Q-wave development. A more limited type of infarction, known as acute non–ST-elevation MI, typically results from an acute partially occlusive coronary thrombus. In such infarctions, it is ST-segment depression and/or T-wave inversion, rather than ST elevation, that appears in the leads overlying the ischemic myocardium.
The extent of myocardial damage with this form of infarction is less than in STEMI, often involving only the subendocardial layers of the myocardium. As a result, pathologic Q waves do not develop, because the remaining viable cells are able to generate some electrical activity.
In non–ST-elevation MI, the diastolic current theory maintains that diastolic ionic leak of injured cells adjacent to the subendocardial infarct zone generates electrical impulses directed from the inner endocardium to the outer epicardium and therefore toward the overlying ECG electrode. Thus, the baseline of the ECG is shifted upward. Following full cardiac depolarization, the electrical potential of the heart returns to true zero but, relative to the abnormal baseline, gives the appearance of ST-segment depression.
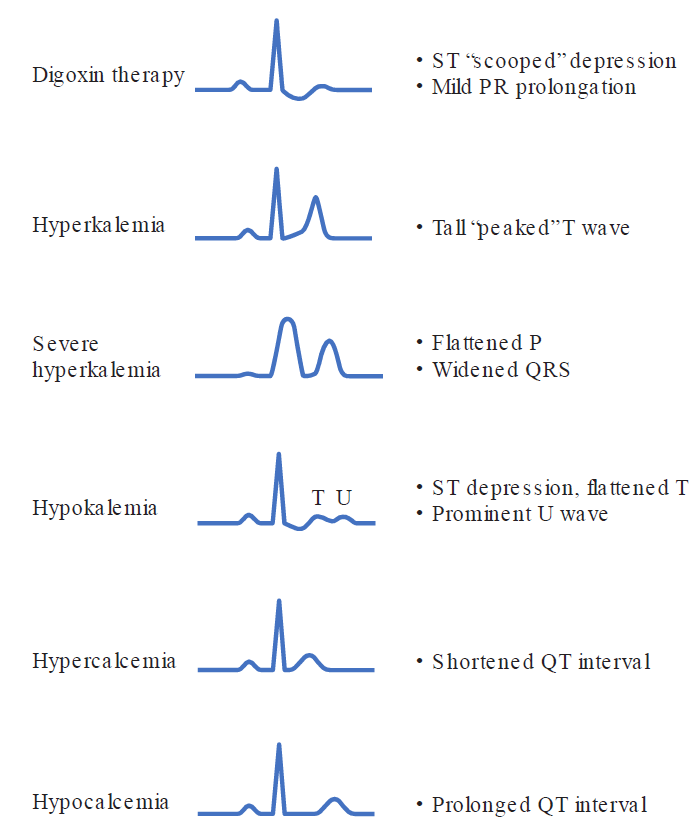
In addition to myocardial ischemia and infarction, there are several other causes of ST-segment and T-wave abnormalities that result from alterations in myocyte repolarization. The most commonly encountered of these are:
Further recommendations
ECG is one of those skills that need clinical practice to completely retain. First of all, I would recommend you reread the chapter to retain as much information as possible. Then I would recommend to either practice ECG interpretation clinically under the guidance of a mentor. Other viable options to practice ECG interpretation include free online resources like Harvard’s ECG Wave-Maven, which is a vast free ECG library that contains features like quiz mode that can help you develop your ECG interpretation skills.
Other resources include ECG Weekly and the ECG section on LITFL.